Electrify Chicago
According to the
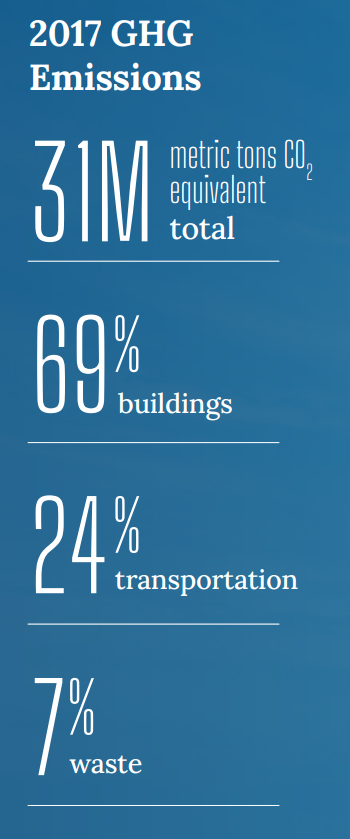
2022 Chicago Climate Action Plan ,
a whopping 69% of Chicago's emissions come from buildings, making it
our biggest challenge and our biggest opportunity as a city to tackle
change. At Electrify Chicago we want to showcase some of the best and worst performing
buildings in the city using publicly available data and manual annotations to add
building photographs and label multi-building owners like universities.
,
a whopping 69% of Chicago's emissions come from buildings, making it
our biggest challenge and our biggest opportunity as a city to tackle
change. At Electrify Chicago we want to showcase some of the best and worst performing
buildings in the city using publicly available data and manual annotations to add
building photographs and label multi-building owners like universities.
You can start by looking at Chicago's buildings with the highest greenhouse gas intensity - this means that they use the most energy when adjusted per unit of square foot, so big buildings could actually perform much better than very inefficient small buildings on this metric.
Chicago Buildings by Greenhouse Gas Intensity
Note: Data only includes large Chicago buildings from 2020
Note: This data only includes buildings whose emissions are reported
under the
Chicago Energy Benchmarking Ordinance. According to the City “As of 2016,
this list includes all commercial, institutional, and residential buildings larger than
50,000 square feet.” This dataset is also then filtered to only buildings with
reported emissions > 1,000 metric tons CO2 equivalent.
This data is also from 2020, but when new benchmark data is available, we'll update the site.
| Property Name / address | Primary Property Type |
Greenhouse Gas Intensity (kg CO2 eq./sqft) |
Total Greenhouse Emissions (metric tons CO2 eq.) |
|---|---|---|---|
|
One North Wacker
🚩
1 N Wacker Dr
| Office | 7.9 kg/sqft
Highest 47%
| 12,683 tons
Highest 4%
|
|
225 W Washington
225 W Washington St
| Office | 7.9 kg/sqft
Highest 47%
| 4,186 tons
Highest 20%
|
|
Eight O Five
805 N LA SALLE DR
| Multifamily Housing | 7.9 kg/sqft
Highest 47%
| 2,122 tons
Highest 47%
|
|
10 S LaSalle St
10 S LaSalle St
| Office | 7.9 kg/sqft
Highest 47%
| 6,859 tons
Highest 10%
|
|
Domestic Violence Courthouse
555 W Harrison St
| Courthouse | 7.9 kg/sqft
Highest 47%
| 1,488 tons
Lowest 29%
|
|
Nightingale Elementary -CPS
5250 S Rockwell St
| K-12 School | 7.9 kg/sqft
Highest 47%
| 1,111 tons
Lowest 8%
|
|
Waterford Condominium
4170 N Marine Dr
| Multifamily Housing | 7.9 kg/sqft
Highest 47%
| 2,642 tons
Highest 36%
|
|
Juarez Com Academy HS -CPS
2150 S Laflin St
| K-12 School | 7.9 kg/sqft
Highest 47%
| 2,020 tons
Lowest 49%
|
|
1310 N RITCHIE CT
1310 N RITCHIE CT
| Multifamily Housing | 7.9 kg/sqft
Highest 47%
| 1,436 tons
Lowest 26%
|
|
Federal Railroad Retirement Board
844 W Rush St
| Office | 7.9 kg/sqft
Highest 47%
| 3,030 tons
Highest 30%
|
|
3300 3306 W DIVERSEY AVE
3300 3306 W DIVERSEY AVE
| Multifamily Housing | 7.9 kg/sqft
Highest 47%
| 1,434 tons
Lowest 26%
|
|
Inland Steel Building
30 W Monroe
| Office | 7.9 kg/sqft
Highest 47%
| 2,389 tons
Highest 41%
|
|
Granville Court Condominiums
2025 W Granville Ave
| Multifamily Housing | 7.9 kg/sqft
Highest 47%
| 1,824 tons
Lowest 43%
|
|
Winston Towers No. 5
7141 N Kedzie Ave
| Multifamily Housing | 7.9 kg/sqft
Highest 47%
| 2,265 tons
Highest 44%
|
|
Lincoln Park Tower Condominium Association
1960 N Lincoln Park West
| Multifamily Housing | 7.9 kg/sqft
Highest 47%
| 2,624 tons
Highest 36%
|
Data Source:
Chicago Energy Benchmarking Data